Load & Explore Data
Actable AI provides numerous ways for you to connect and explore data. This documentation presents you with easy hands-on instructions on the following:
Connect your database with Actable AI
Upload new data from your PC
Edit and delete your data
Use provided functions to explore your data
However, if you’re just testing Actable AI, we provide several data samples to help you explore our functionalities. You can jump to Exploring Data and Analytics.
Connect to a New Database
Actable AI is capable of analyzing datasets that exist in your own database once you set up the connection. To connect Actable AI with your database, please follow these steps:
Ensure that you are signed in to your account, or create a new one if you do not already have one.
Click the Databases button on the top left corner to let Actable AI gain access to your database.

The list of connected databases is now shown.

Click the ‘plus’ ( + ) button on the top right corner to add a new database. The following screen will allow you to configure the connection options. Ensure that you already have a database configured and that you can connect to it from the instance on which you’re running Actable AI.

You can test your connection before saving the configuration by clicking the Test Connection button. Click the Save button to store the configuration once you are sure that the connection configuration is correct. The browser will redirect back to the Databases view and the newly set-up database will appear in the list.
More options can also be accessed by clicking the More Options button, as shown in the image below:
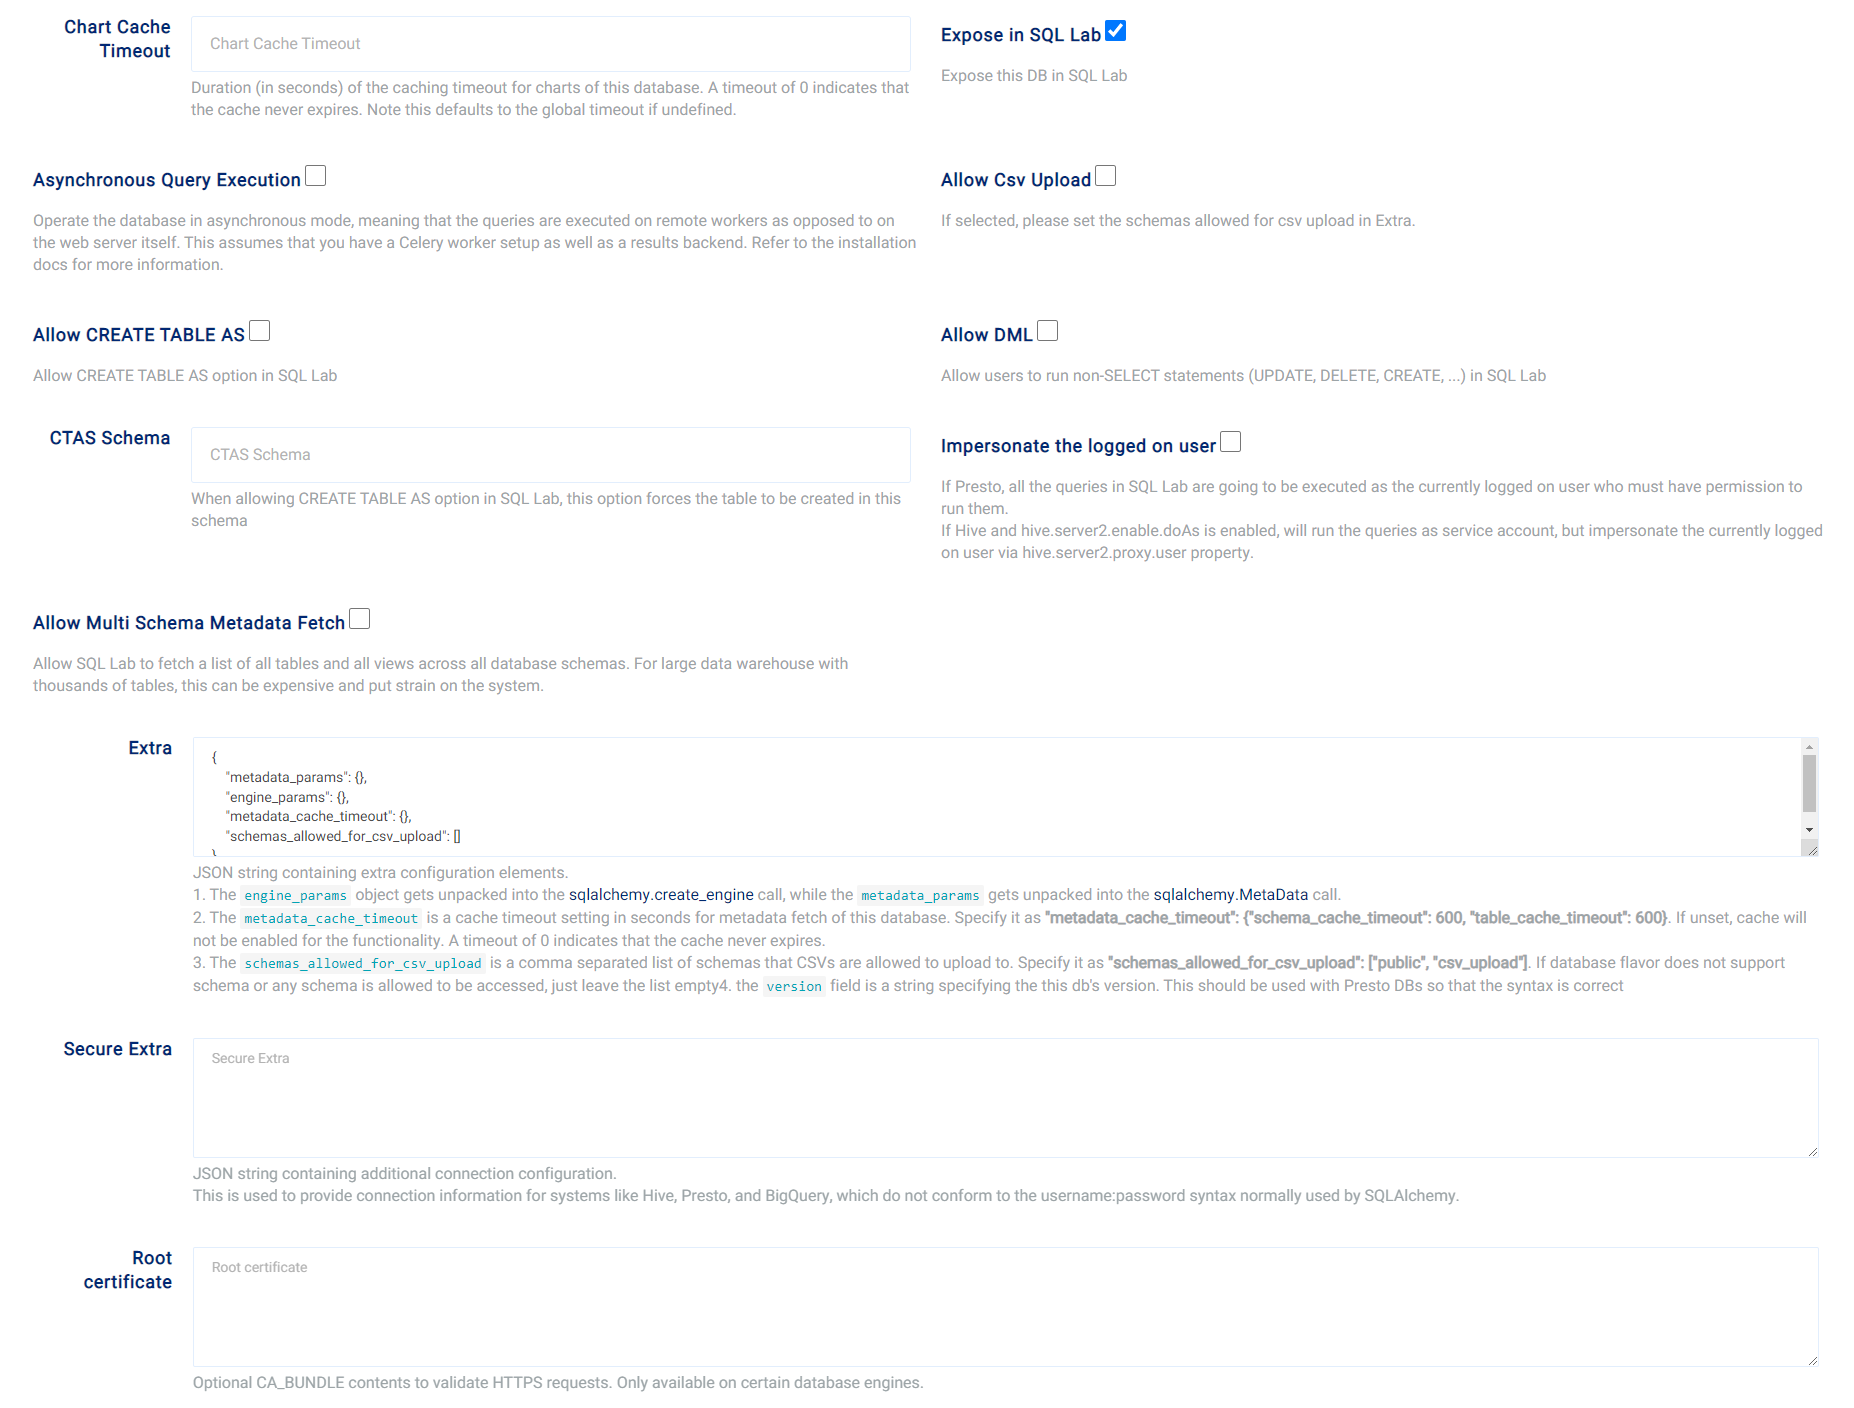
Now that you’ve configured a database, specific tables from your database that you’d like to query can be connected to Actable AI. Click the Connect to Table button, and select the table that you want to connect with Actable AI by choosing the target Database, Schema and Table Name.

Note
You can type the name in order to quickly find the required option from the long list.
Note
If the table exists in the “default” schema (e.g. the public schema in PostgreSQL or Redshift), you can leave the schema field blank.
Click on the Save button to save the configuration and to be redirected back to the list of tables. You should see a message indicating that your table was created.
The following Relational Database Management Systems (RDBMSs) are currently supported:
Upload New Data
If you would like to work with new data, you can use our upload functions. Actable AI supports both CSV and Excel files.

Upload CSV files:

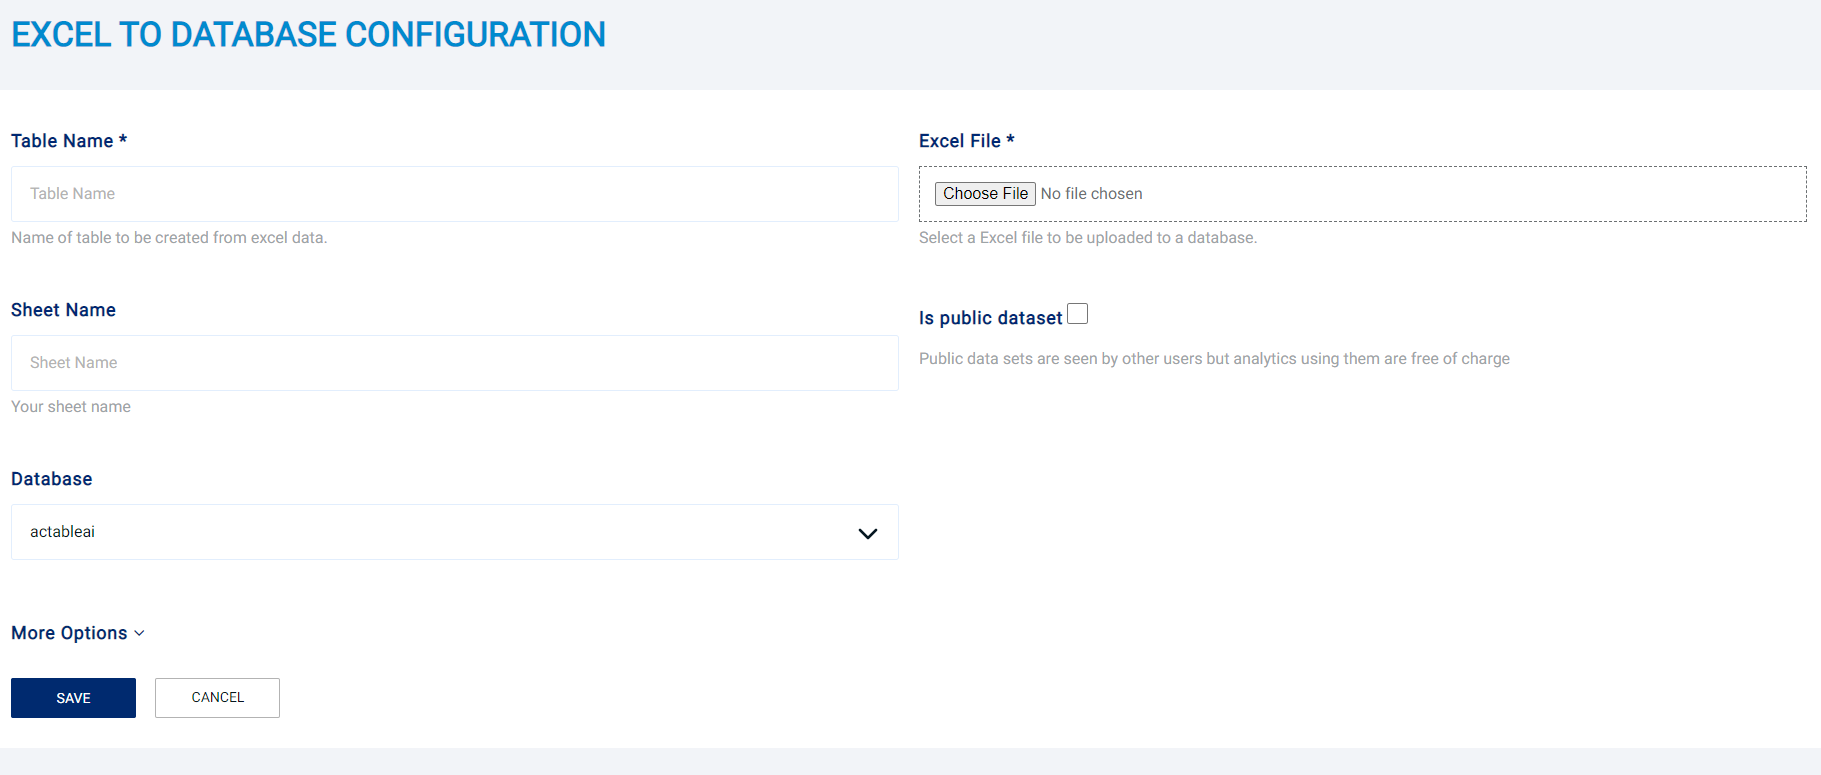
Upload Excel files:
Note
The exact sheet can be specified. If left blank, only the first sheet in the Excel file is used.
For both CSV files and Excel files, the Is public dataset option can be selected to make the dataset visible by other Actable AI users. Analytics on this publicly available dataset are free of charge.
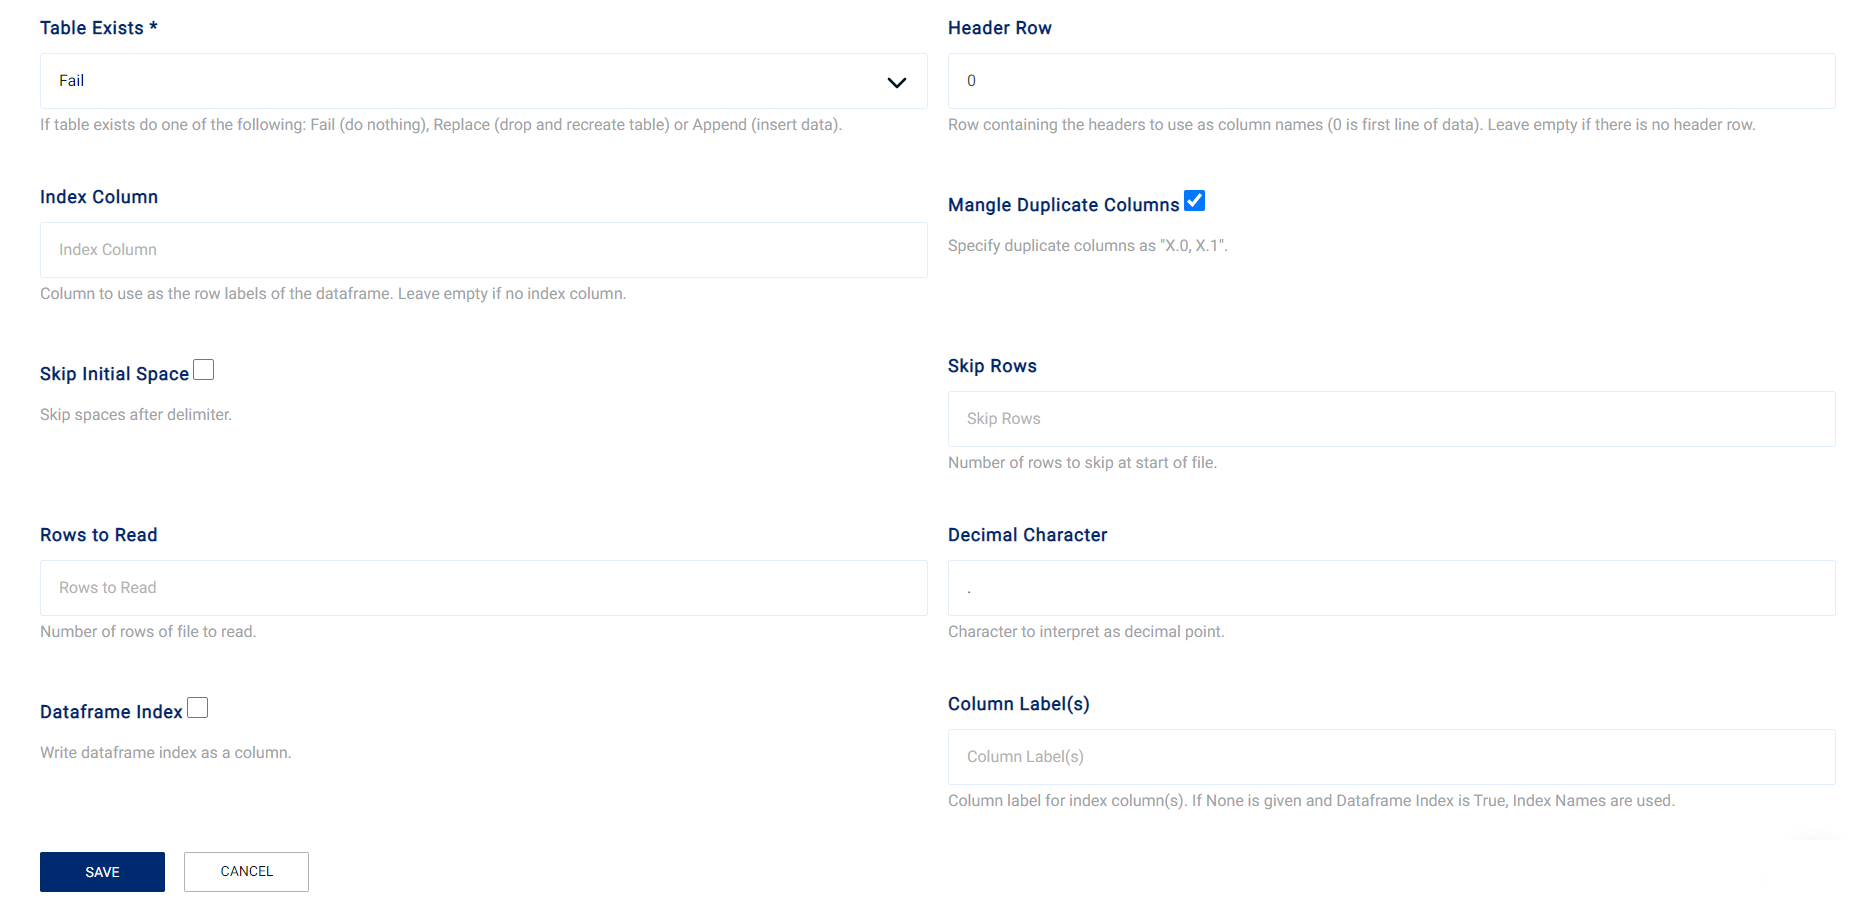
To get more control, you can also access more options by clicking the More Options button where you can specify the database schema you want to upload to, whether to replace if the table exists, rows to read/skip, delimiter character (for CSV files only), etc.
Control Your Data
We respect users’ privacy. You always have full control of the table connected with Actable AI. You can edit or delete a connected table or database at any time.
In order to edit a database, go to the Databases view (by clicking the Databases button on the top left), click the Edit button for a database source. You can also decide to Delete an existing connection.

After clicking the edit button, you can change the database connection in the following page:

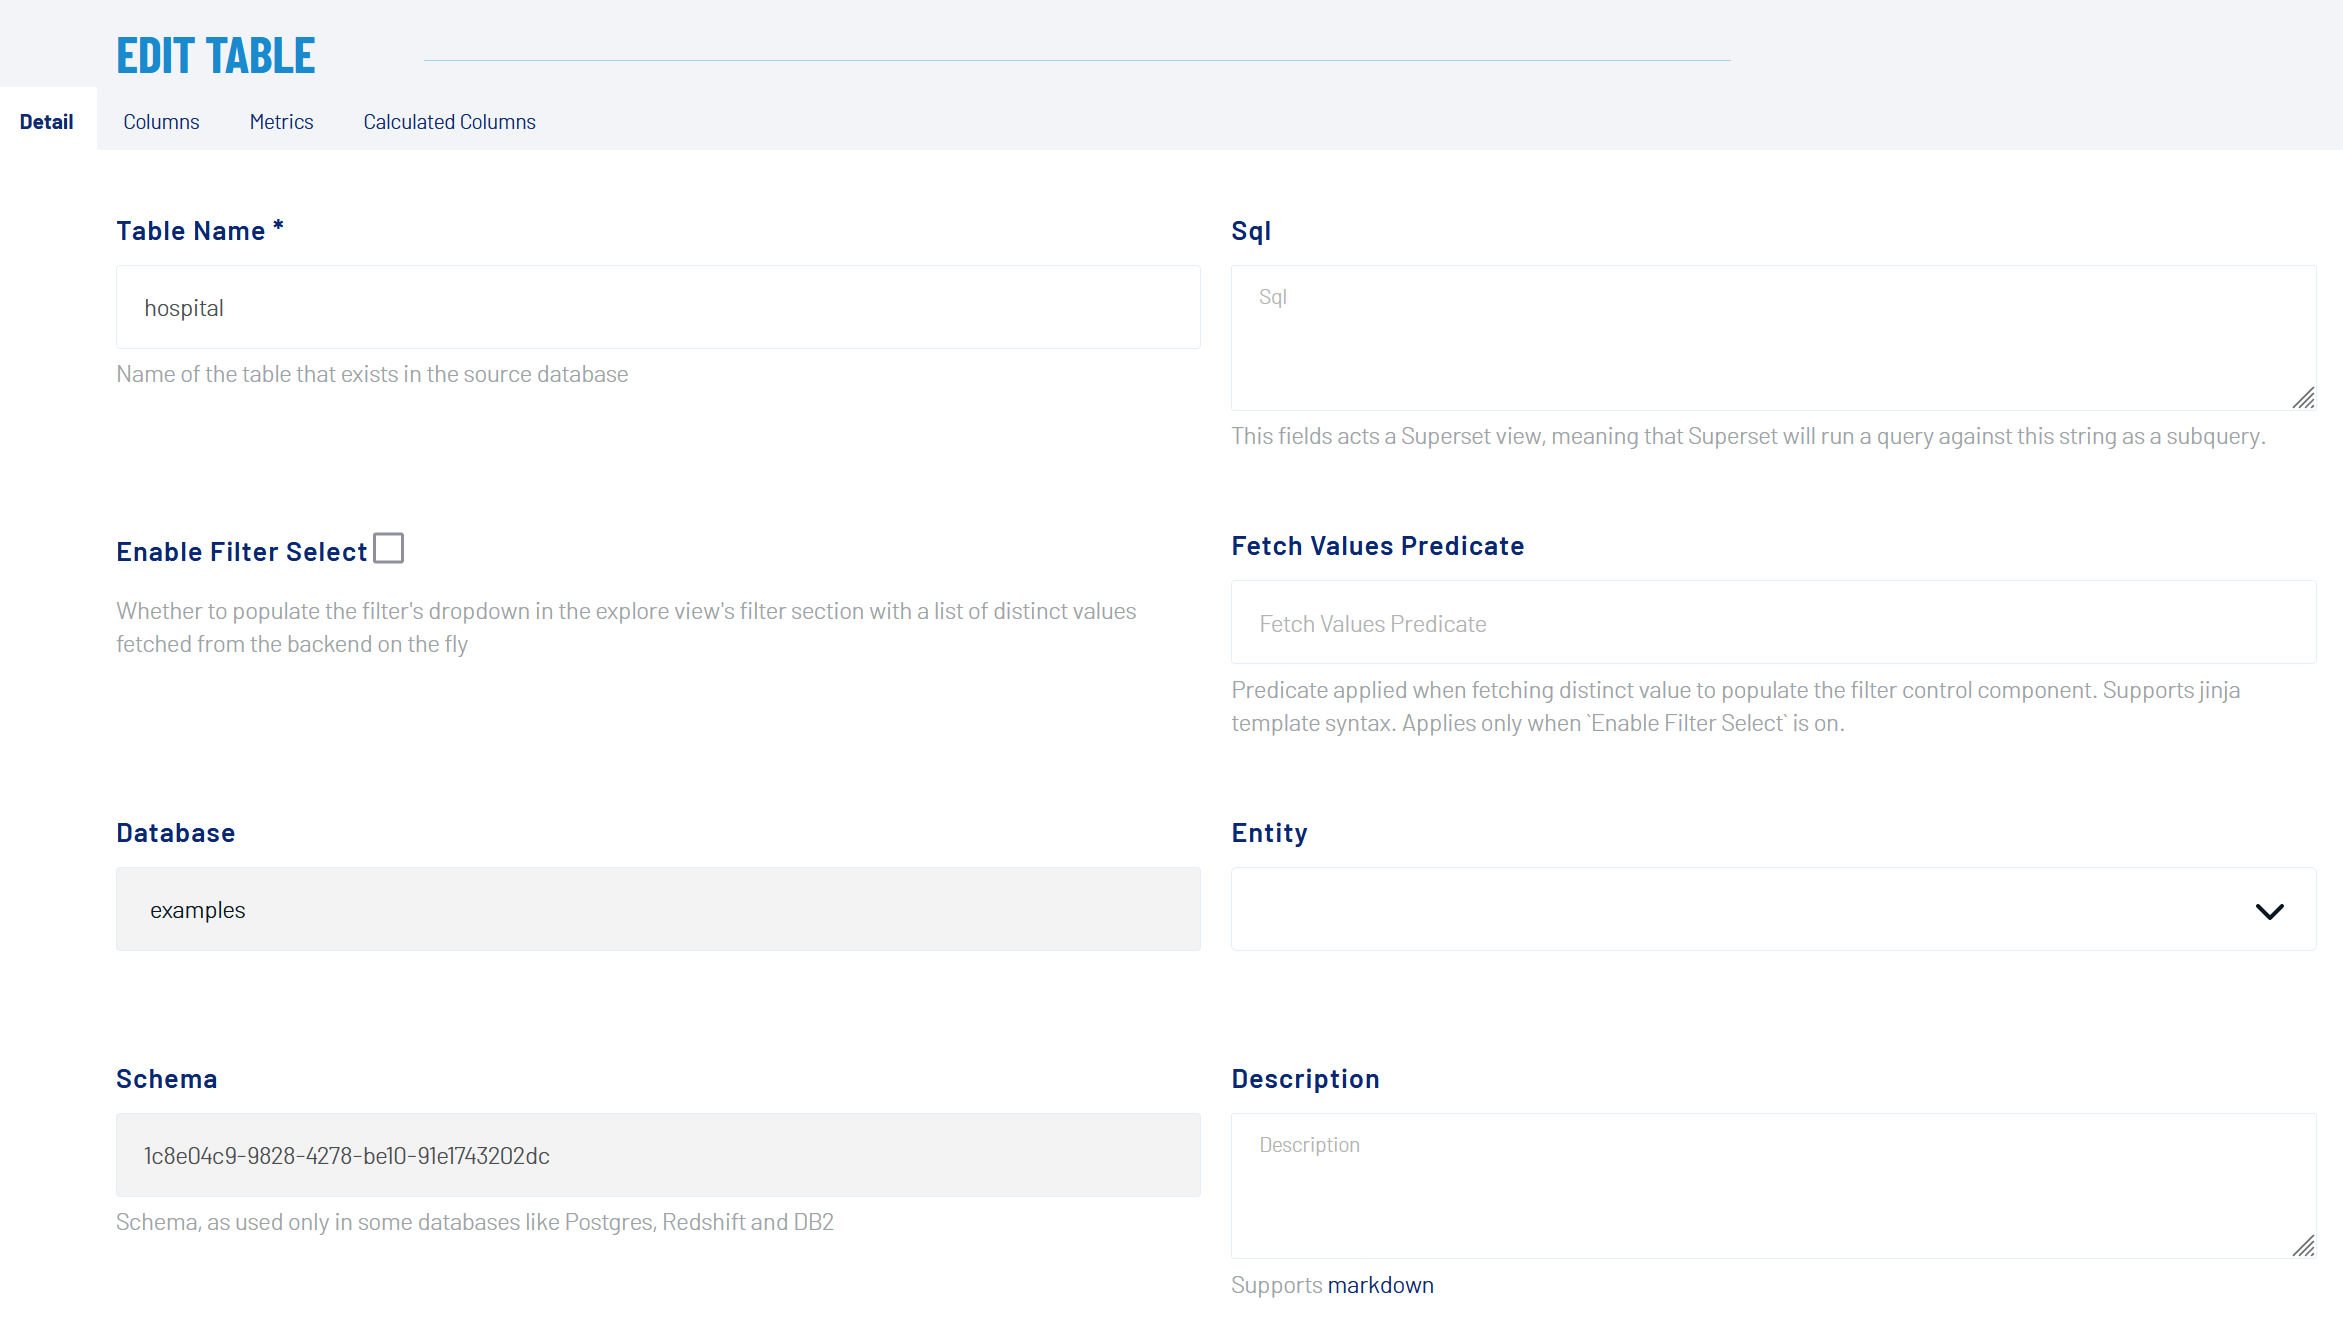
To edit a table, go back to the Data view, and click the edit button for the table. You may even remove the table connection.

After clicking the edit button, you can see the following window:
Note
The above operations do NOT affect your own data source.
Actable AI also provides two useful features that can enrich your dataset: Metrics and Calculated Columns.
The Metrics feature lets you customize additional operations for dataset columns, while the Calculated Columns feature lets you create additional columns.
The Is temporal field should be checked for any date or time fields. It helps the app to slice and dice the column(s) in time series charts.

Warning
You may notice that you can even edit a specific column in this view, such as by disabling the Filterable/Groupable options, and the column type can even by overridden. However, be cautious when you do these operations: the app may fail to read the table correctly.
As with the configurations above, click the Save button to save these settings.
Exploring Data
Analytics View
To start exploring your data, simply click on the table name you just created in the list of available tables. Actable AI provides a search bar on the top right corner if you are not able to find your table. We are going to use wb_health_population as an example:

Once the data is loaded (it might take slightly longer to load larger datasets), you can see the following screen:
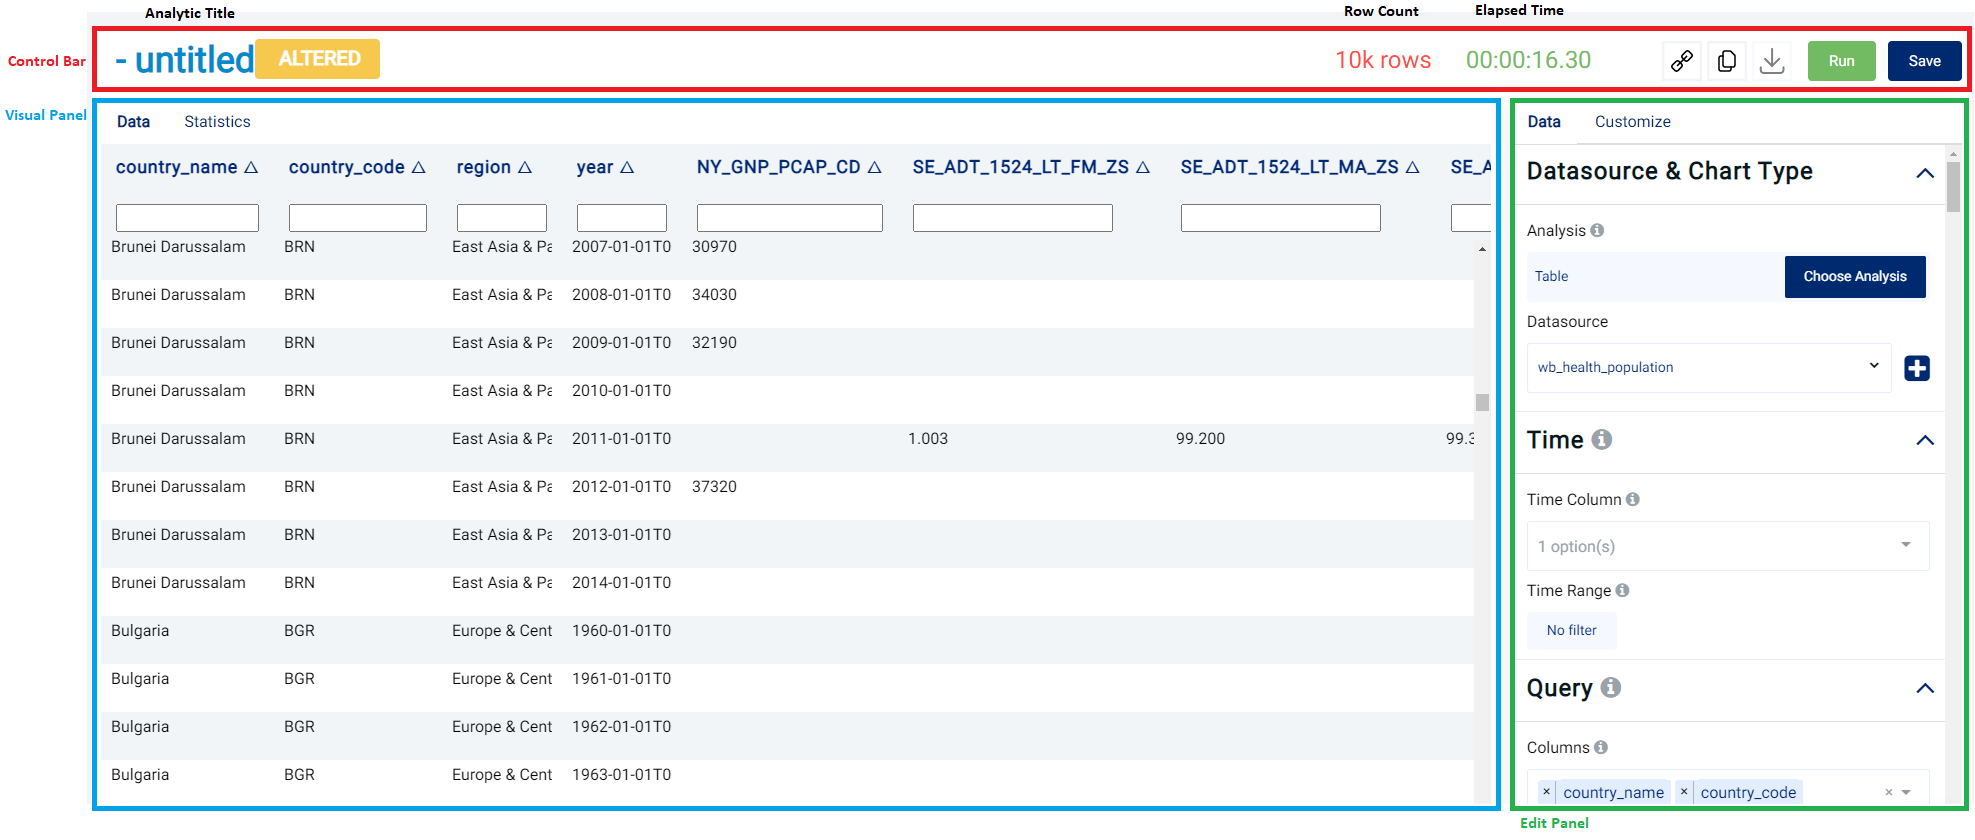
The screen has three parts: control bar, visual panel, edit panel:
In the control bar (top), the analytic title, row count, and task elapsed time are displayed. You can also run/save your analytics, duplicate your analytics, download the result, and share your analytics with your friends and colleagues.
Note
The task elapsed time includes both the task queuing time and the computation time. We only charge for the computation time.
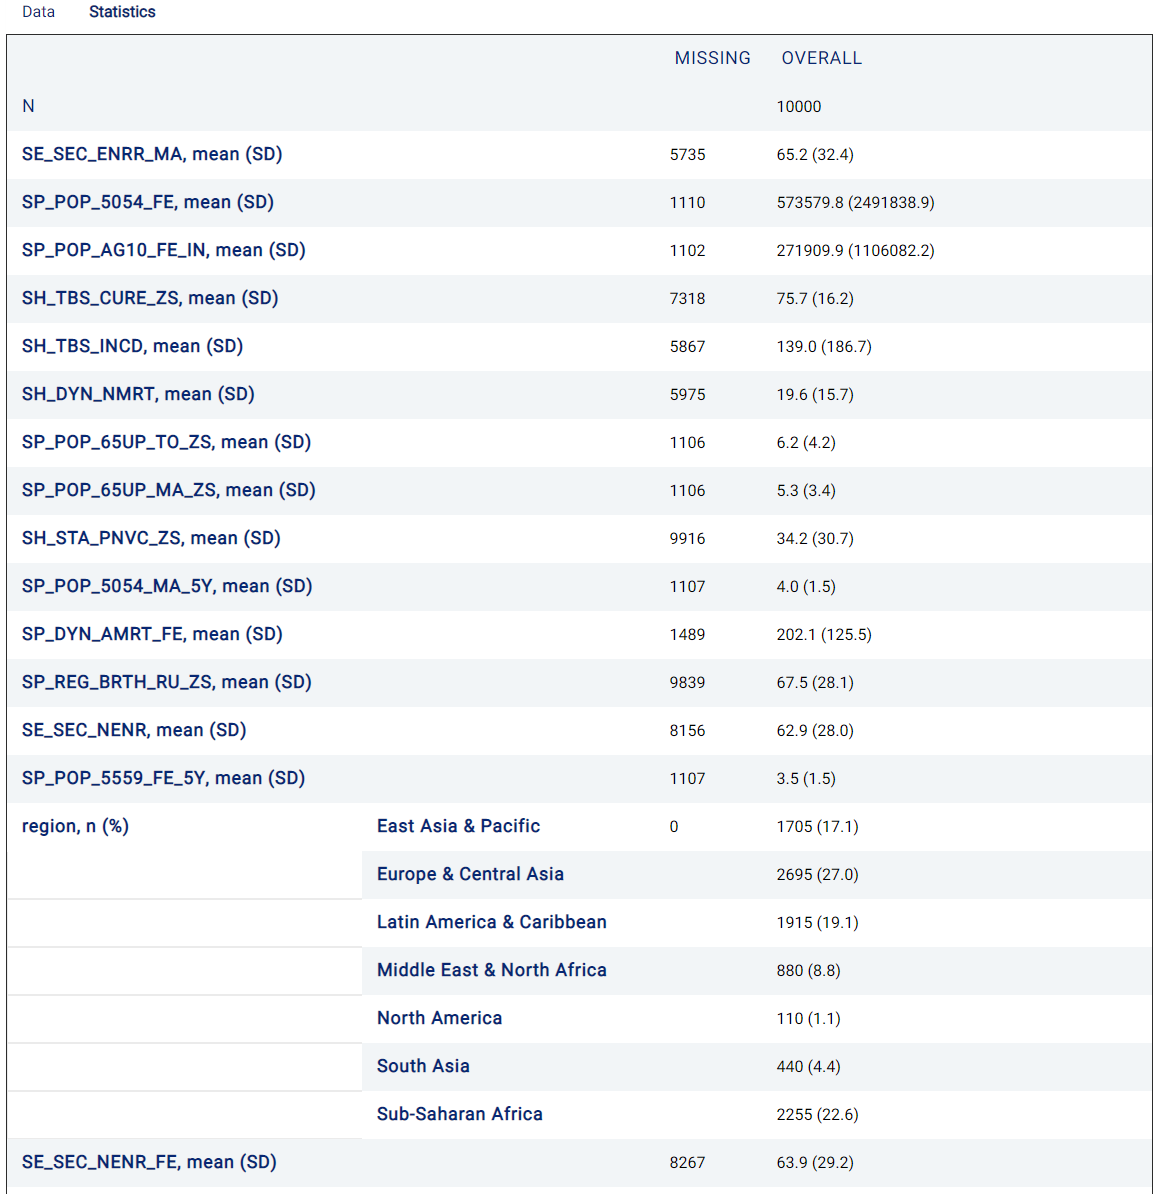
The visual panel (left) may vary according to the analytics type. We will cover this in the Analytics section. For the Table analytic (shown when uploading new datasets), the Statistics tab shows useful information about the features in the dataset, such as the number of missing values, the mean of values, and the standard deviation of values:
The edit panel (right) is where you control your analytics and tune your parameters.
Example
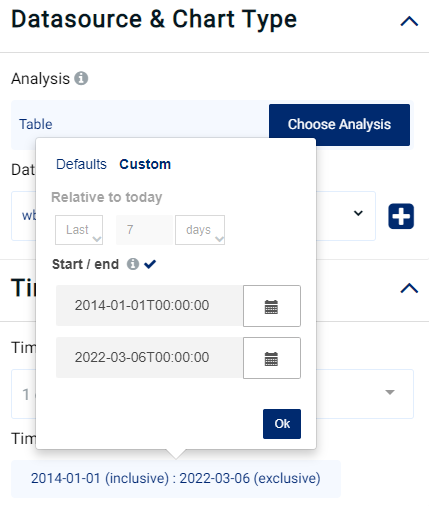
Let’s walk through a basic example to get the count of all records in our table for a certain period of time. First, we’ll need to change the Time range filter to capture the range of our data. Set up a filter using Custom and Start/end.
Look for the Metrics section, and start typing “Count”. You will then see a list of metrics matching what you type:
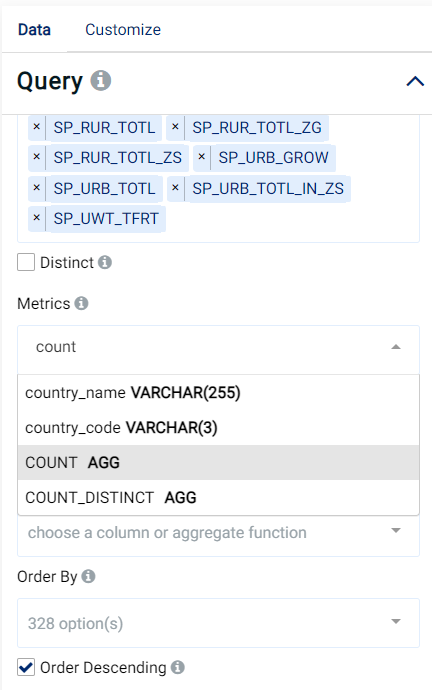
Select any column you want to count. In this example, we are going to count for the country_name column.
Warning
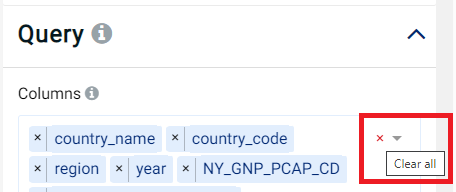
Remember to remove the columns! This can be done by clicking on the ‘cross’ ( x ), as shown in the image below. Otherwise, the app will try to display all columns as well as the aggregate count column, which may cause an error.
Your final settings should look like the following:
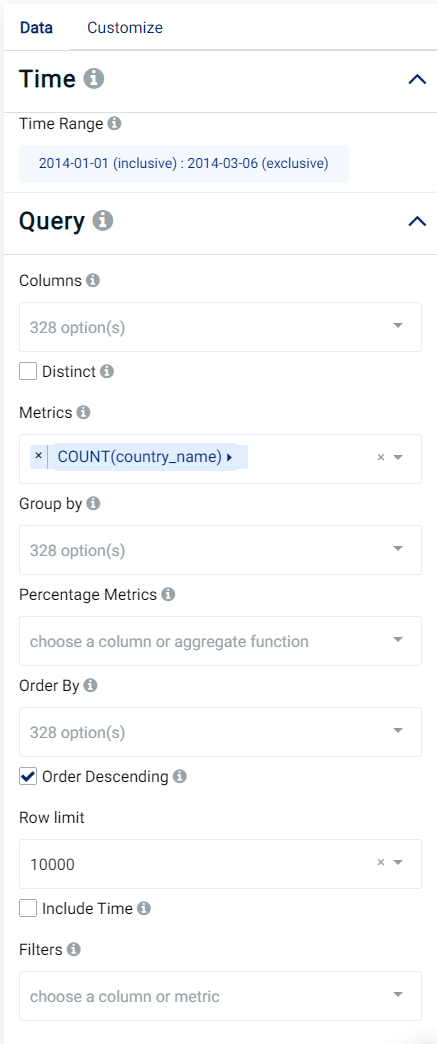
Click the Run button in the control bar. After a few seconds, you should be able to see the final results in the visual panel.
Custom SQL is supported: in the Metrics control, click on the COUNT(country_name) that we just did, switch to the Custom SQL tab, and write your SQL commands. For example, if we would like to count unique values for a country name, we can do COUNT(DISTINCT(country_name)).
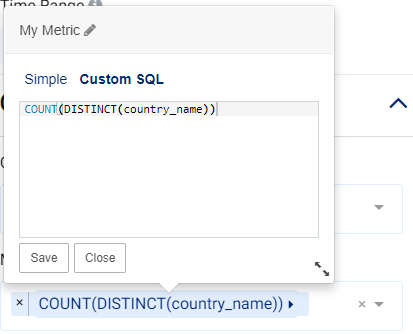
The metric name can also be edited (by clicking the pencil icon next to My Metric in the above image), and then clicking the Save button. The new name will now be used to represent the custom SQL command (instead of the command itself, which can make it easier to understand the function of the SQL command):

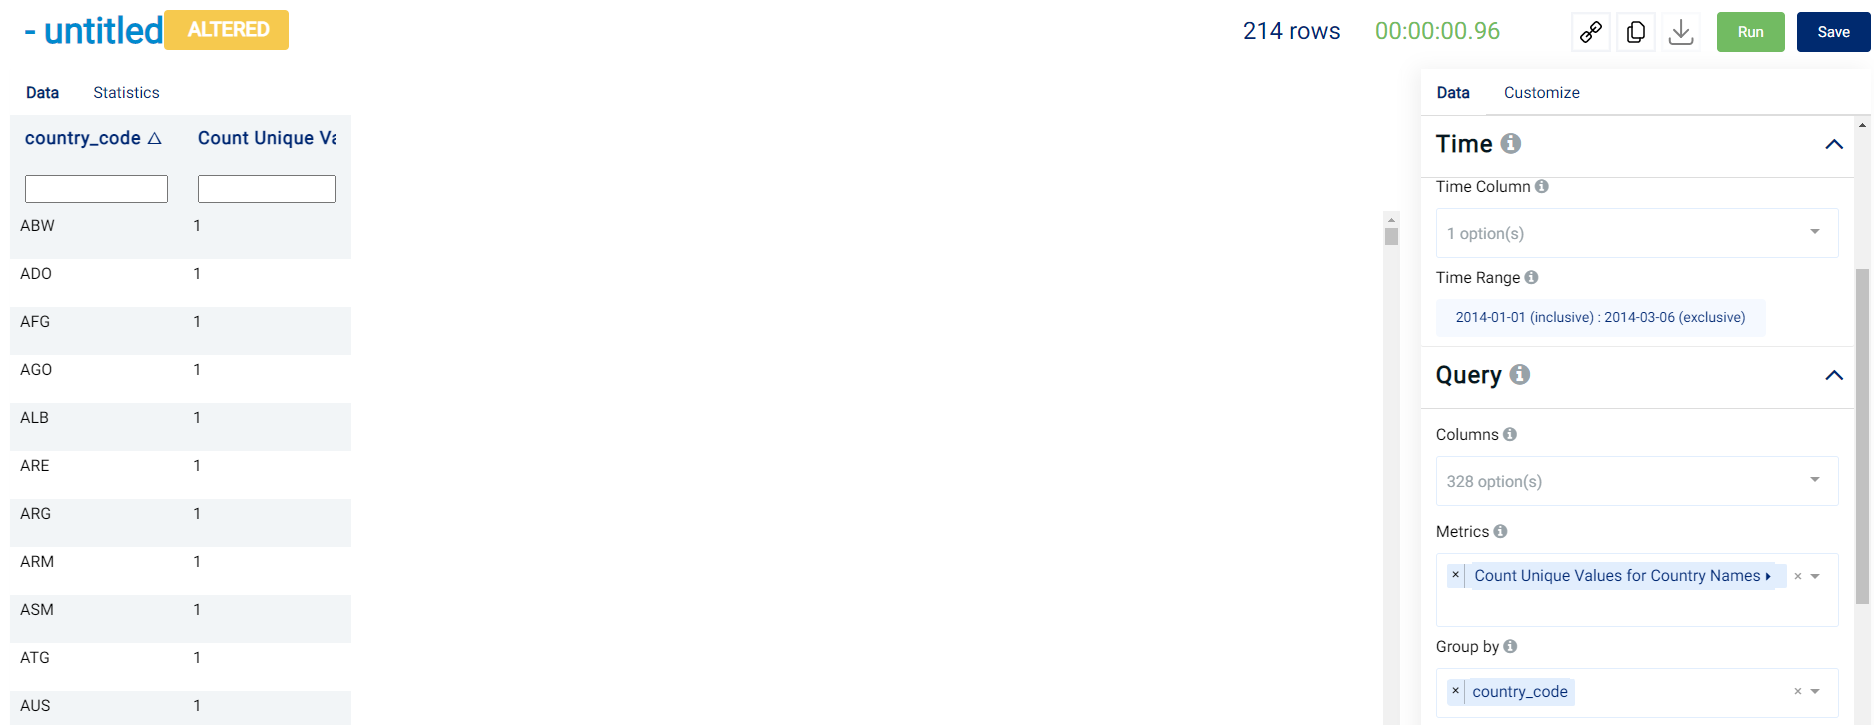
Furthermore, to view the number of unique country names for each country code in this table, we can group by the country_code variable, as shown in the next picture:
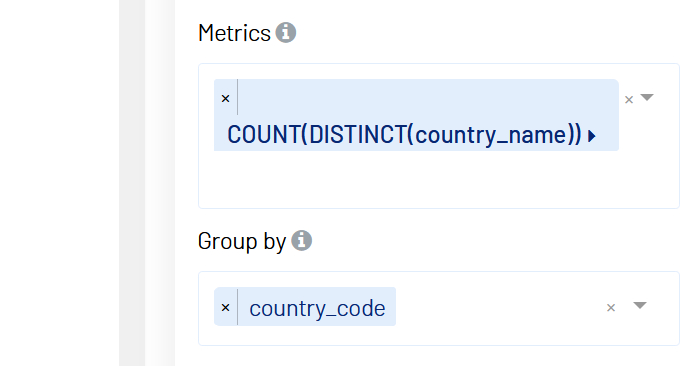
Press the Run button again. After a few seconds, the following result is shown:
SQL Lab
A simple example of how Actable AI could help you explore your data was shown. However, in most cases, you may want to explore your data in further detail. To this end, SQL Lab can be used - a modern, feature-rich SQL IDE that enables you to explore your data further.
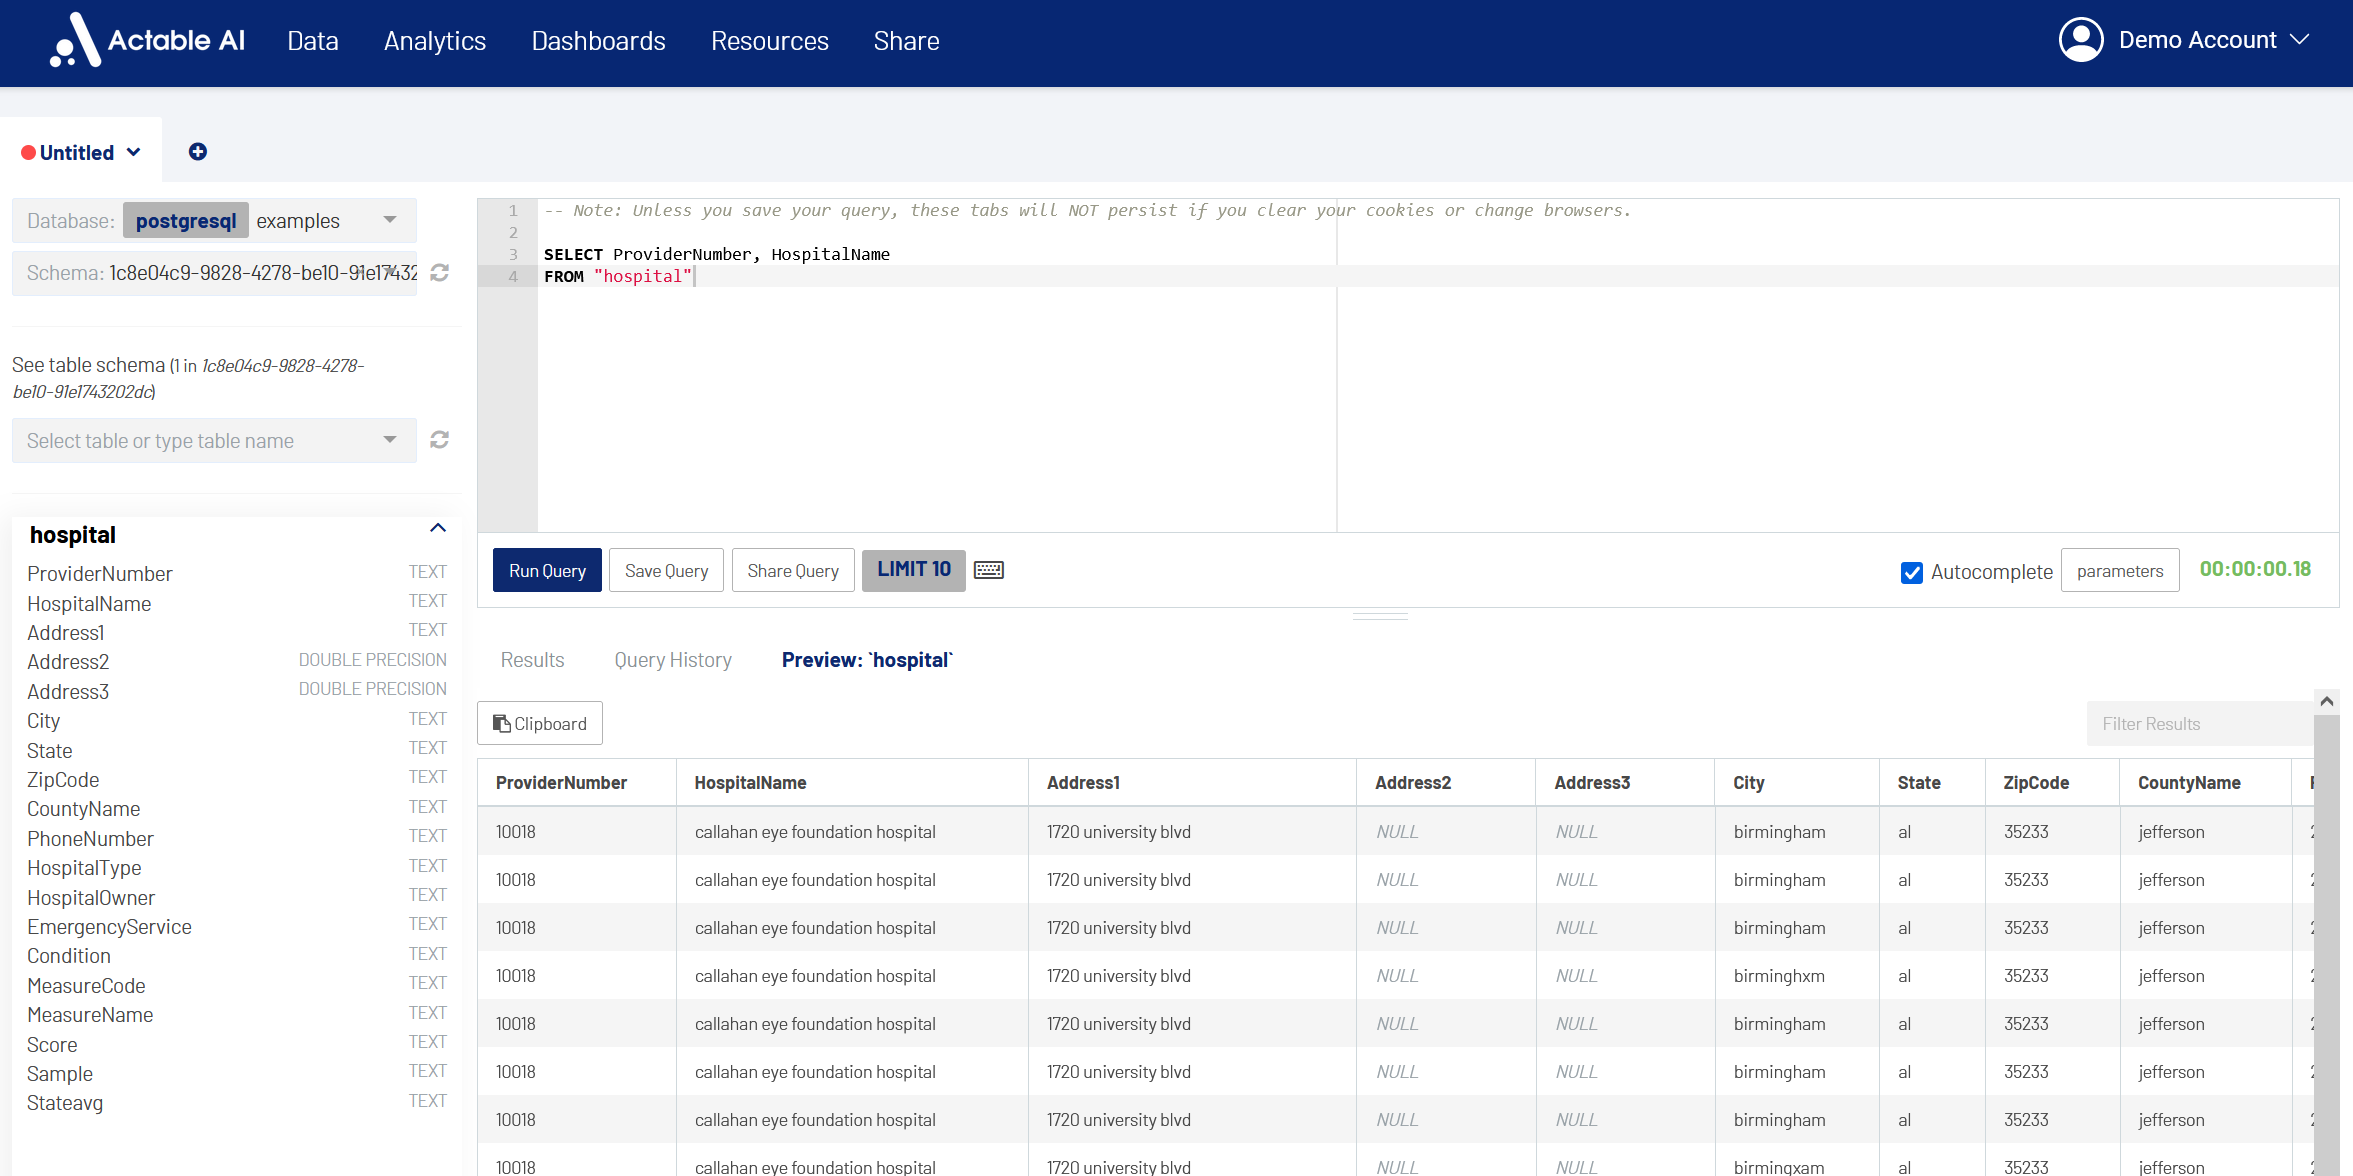
SQL Lab provides the following features:
Ability to connect to just about any database backend.
A multi-tab environment to work on multiple queries at a time.
A smooth flow to visualize your query results using Actable AI’s rich visualization capabilities.
Browse database metadata: tables, columns, indexes, partitions.
Support for long-running queries.
A query history tab to find queries executed in the past.
Save query and share query to enable query reusability.
To get started, please set up the database and schema. The interface will focus on the connection you selected.
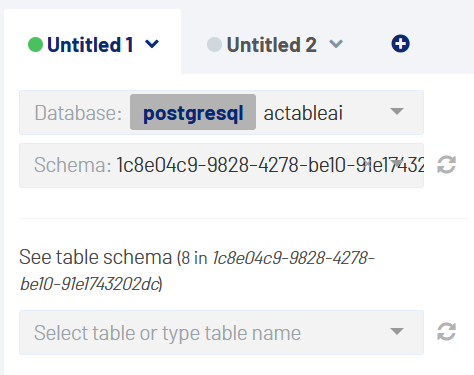
The preview appears when interacting with the input box. SQL Lab has both table schema and content preview. Preview content can be made available for copying by clicking the clipboard button.

Previously executed queries are listed in the Query History tab, where the action buttons can be used to edit or delete the queries.

The Save Query button saves the SQL result as a new table for future analysis.