Association Rules
Introduction
Association Rules can be used to find associations between different subjects in a dataset. For example, based on historical data, one can find out what items are usually bought together.
The most frequent itemsets (unordered sets with two or more distinct items) are first generated from the transactions (set of items) in a dataset, following which the association rules are generated from these frequently occurring itemsets.
Parameters
There are two tabs containing options that can be set: the Data tab, and the Advanced tab, as follows:
Data tab:
Group by: Columns used to group associated items together (e.g. the order id for online orders)
Items: Items for which the association rules are to be found (e.g. product id for products in a shop)
Frequent itemset generation method: Method used to generate frequent itemsets, which can be either FP-Growth, Apriori or FP-Max.
Note
FP-Growth is the same as Apriori but is faster on average. FP-Max generates only the maximal itemsets, such that the set of frequent maximal itemsets is a subset of frequent itemsets (in other words, frequent itemsets contained in larger frequent itemsets are discarded).
Minimum support value for frequent itemsets: Minimum value for the support of a frequent itemset. The support refers to the number of times that the itemset appears in the dataset. Lowering this value generates a number of frequent itemsets but causes the analysis to be slower, and the found associations may not be as strong. Values should lie between 0 and 1. The default value is 0.1.
Filters (optional): Set conditions on columns (features), in order to remove any samples in the original dataset which are not required. If selected, only a subset of the original data is used in the analytics.
Furthermore, if any features are related to time, they can also be used for visualization:
Time Column: The time-based feature to be used for visualization. An arbitrary expression which returns a DATETIME column in the table can also be defined, using format codes as defined here.
Time Range: The time range used for visualization, where the time is based on the Time Column. A number of pre-set values are provided, such as Last day, Last week, Last month, etc. Custom time ranges can also be provided. In any case, all relative times are evaluated on the server using the server’s local time, and all tooltips and placeholder times are expressed in UTC. If either of the start time and/or end time is specified, the time-zone can also be set using the ISO 8601 format.
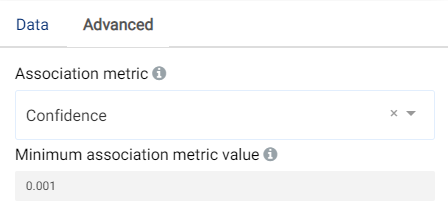
Advanced tab:
Association metric: The metric used to generate the association rules by identifying frequent if-then associations. An association rule possesses an antecedent (A) and a consequent (C). An antecedent (if) can be found in the data, while the consequent (then) is found in combination (and is thus associated) with the antecedent. An association rule between A and C is written as A -> C. Supported metrics include:
Support: Computes the support of the combined itemset A ∪ C, which is the appearance percentage of the consequent and the antecedent in the dataset.
Confidence (default): The confidence of a rule A -> C is the probability of seeing the consequent in a transaction given that it also contains the antecedent.
Lift: Used to measure the statistical dependency of the antecedent and consequent. If A and C are independent, the Lift score will be exactly 1. The higher the score, the higher the dependence.
Leverage: The leverage is the difference between the support (A ∪ C) and the expected frequency of A and C if they were independent. If A and C are independent, the leverage will be exactly 0.
Conviction: The higher the conviction metric, the higher the dependence of the consequent on the antecedent. If items are completely independent the conviction will be equal to 1.
If you unsure which association metric to use, simply use the default confidence metric since it is the natural way to measure the association between two items. More information on association metrics is available at this link.
Note
Sometimes, when using the FP-Max method, there is not enough data for association metrics other than support. In such cases, the association metric automatically becomes support.
Minimum association metric value: Minimum value for the association metric that is used to determine significance. The lower this value, the greater the number of association rules that are shown. Default value is 0.001.
Result View
Association rules: Table showing the antecedents, consequents and the respective association metric for each association rule.
Frequent itemset: Shows the most frequent itemsets and a Histogram of them.
List association: Shows a list of the associated items for each group by.
Association graph: Shows a graph of the association rules. The thicker the line, the greater the value of the association metric. The graph displays only the first 100 association rules.
Chord diagram: Shows a chord diagram of the association rules.
Case Study
Note
This example is available in the Actable AI web app and may be viewed here.
Suppose we are a marketing company and we want to find out which products are most likely to be bought together in a shopping cart. We have a dataset of orders that could look like this:
Member_number |
itemDescription |
|---|---|
1032 |
banana |
655 |
whole milk |
2 |
apples |
1280 |
buns |
1280 |
tropical fruit |
1032 |
tropical fruit |
655 |
other vegetables |
As can be observed, the orders can be grouped by Member_number. We want to find out which products are most likely to be bought together (by a customer).
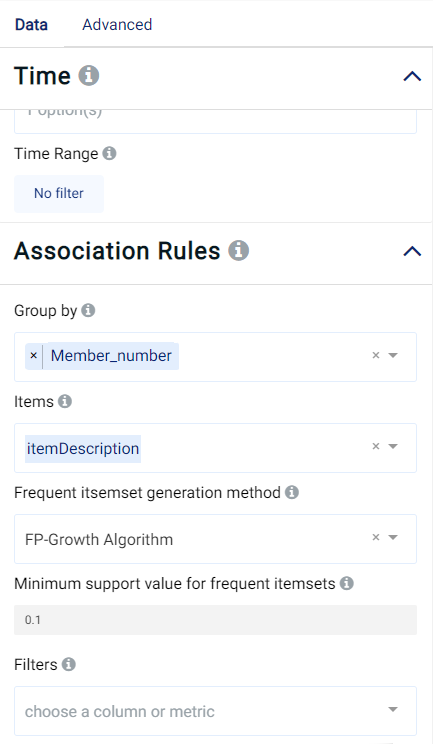
To generate the association rules, the following parameters need to be specified:
The Group by field should only contain
Member_number.The Items (the items for which associations are to be found) is set to the
itemDescriptioncolumn.
The default values are used for the rest of the other parameters.
Data parameters:
Advanced parameters:
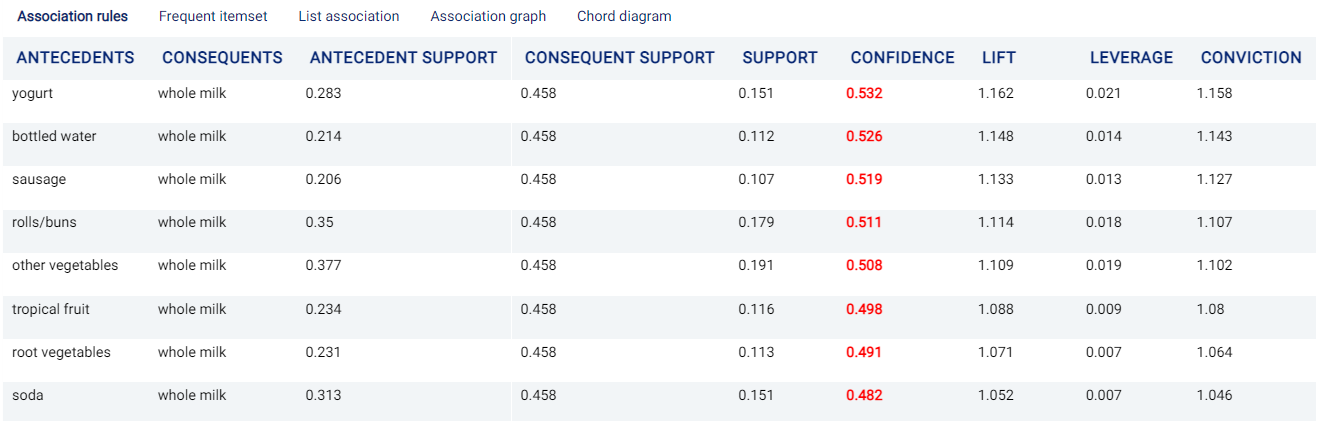
Association rules
A table containing all of the generated association rules is displayed. It can be observed that people buying yogurt will most likely also buy whole milk.
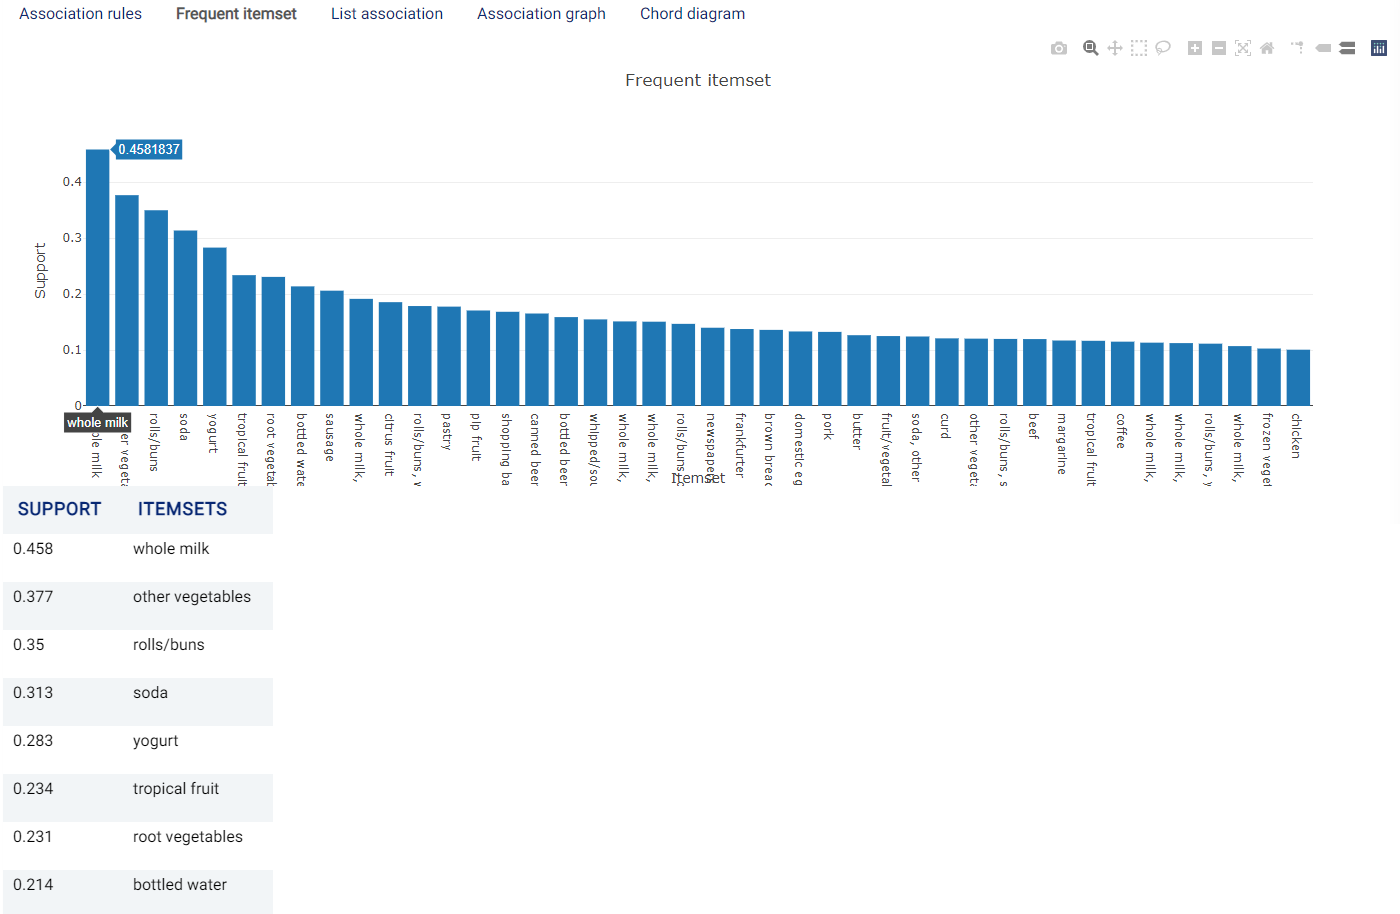
Frequent itemset
A Histogram and a table showing the generated frequent itemsets are shown. As can be observed in the image below, whole milk represents the most frequent itemset, appearing in more than 40% of the orders.
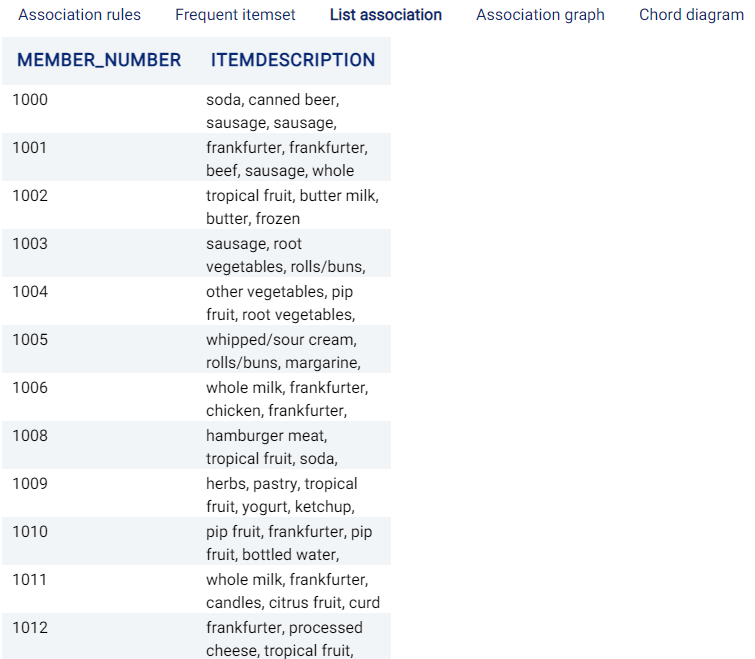
List association
A list of the associated items for each grouped feature. In this example, the items bought by each Member_number are shown:
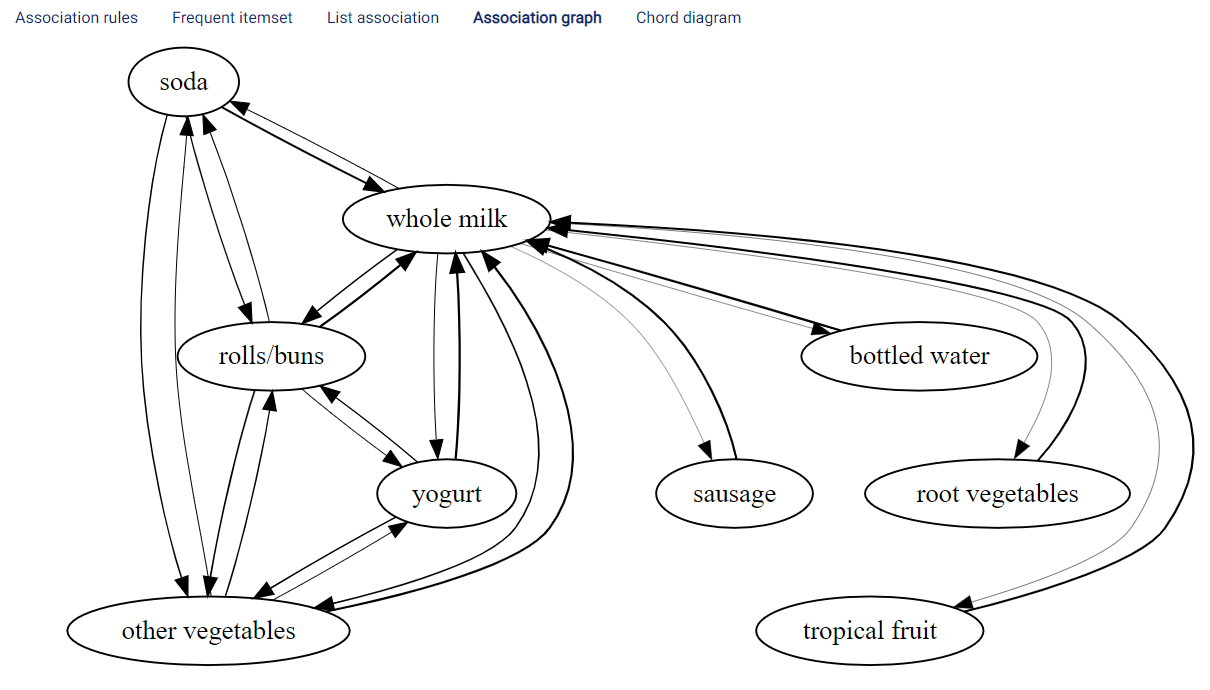
Association graph
A graph showing the association rules. The thicker the line, the higher the value of the Association metric. The graph displays only the first 100 association rules.
In this example, it can be observed that there is a thick edge from yogurt to whole milk. This means that, similar to what was observed in the table shown under the Association rules tab, people buying yogurt will most likely also buy whole milk. People buying soda, tropical fruit, bottled water, sausage, rolls/buns, and other vegetables are also likely to buy whole milk. It is also interesting to note the associations in the opposite directions: for example, people who buy whole milk are not as likely to buy bottled water.
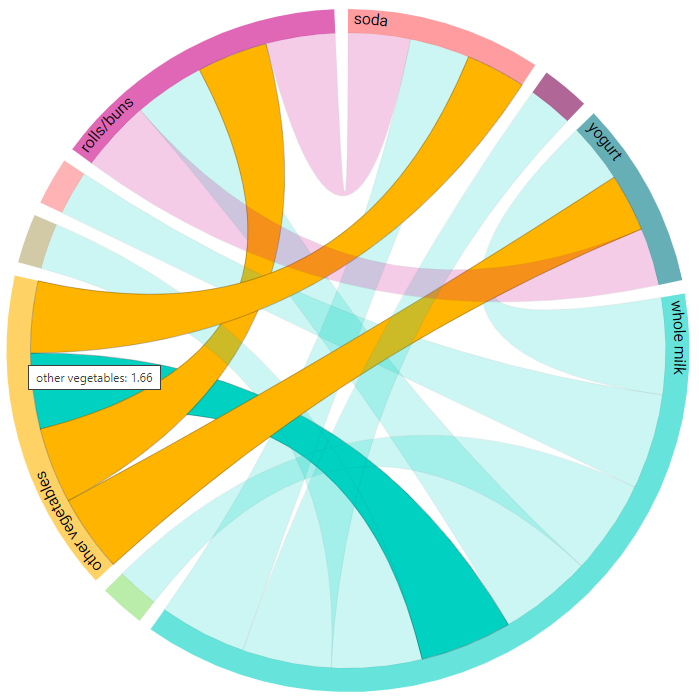
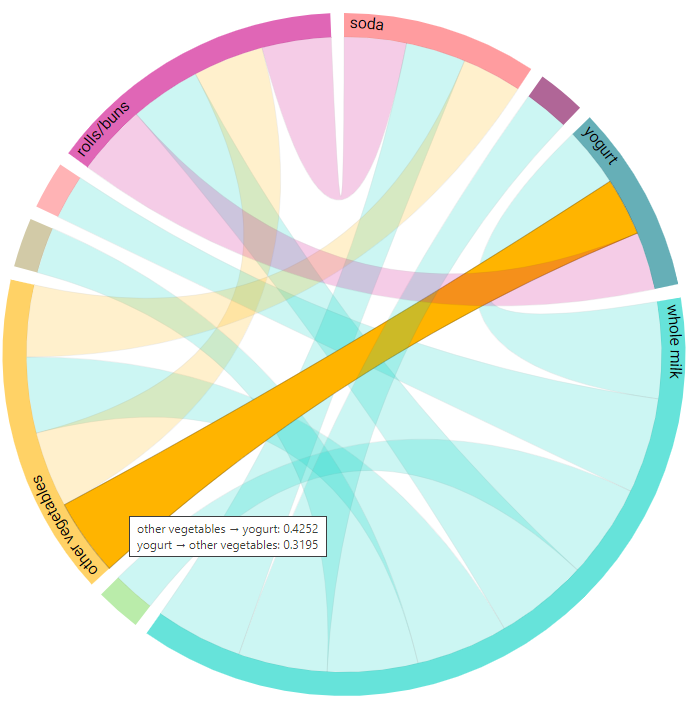
Chord diagram
The connections between the items considered are also shown in a chord diagram, an example of which is shown below:
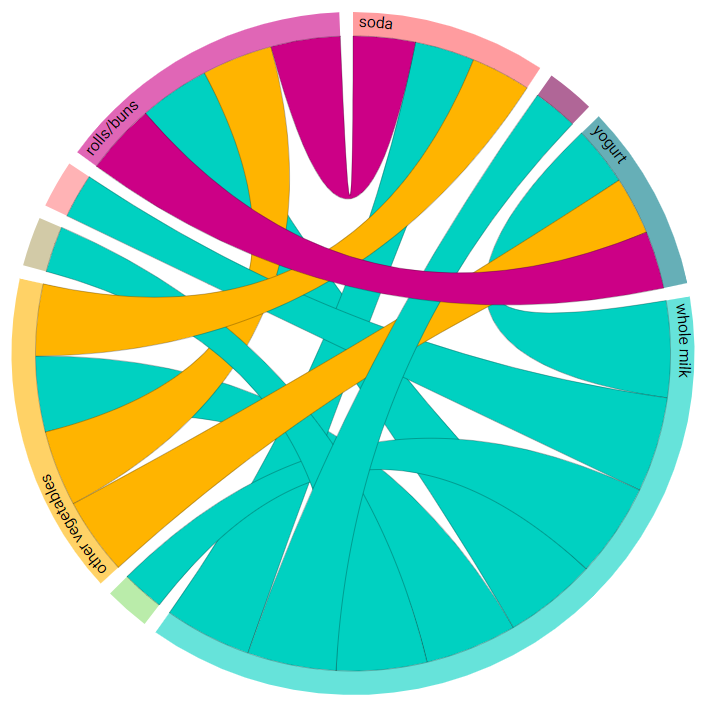
Hovering the mouse over a chord displays the value of the chosen association metric in each direction, as shown in the image below. For instance, in the image below, hovering over the association between vegetables and yogurt shows that the value of the chosen association metric (confidence) when other vegetables is the antecedent (other vegetables -> yogurt) has a value of 0.4252, while the value when other vegetables is the consequent (yogurt -> other vegetables) is equal to 0.3195.
A summary of the chosen association metric is also displayed, using the sum of the metric over all consequents. In this example, for all cases when other vegetables is the antecedent (with soda, rolls/buns, and yogurt as the consequents), the confidence metric amounts to 1.66. This can give an inidcation of the item’s overall strength of associations with other items.